
Turning data into a story is hard. People understand that stories are powerful, but don’t have the scaffolding they need to turn their data into one. This activity introduces a set of “story types” that can be found in data, and uses templates to let people try finding some themselves. It builds participants’ ability to identify stories within formal and informal data sets.
What you need:
- copies of our finding a story worksheets
- copies of our Finding a story handout
- an example dataset you know well
- a real dataset that the participants care about
How you do it:
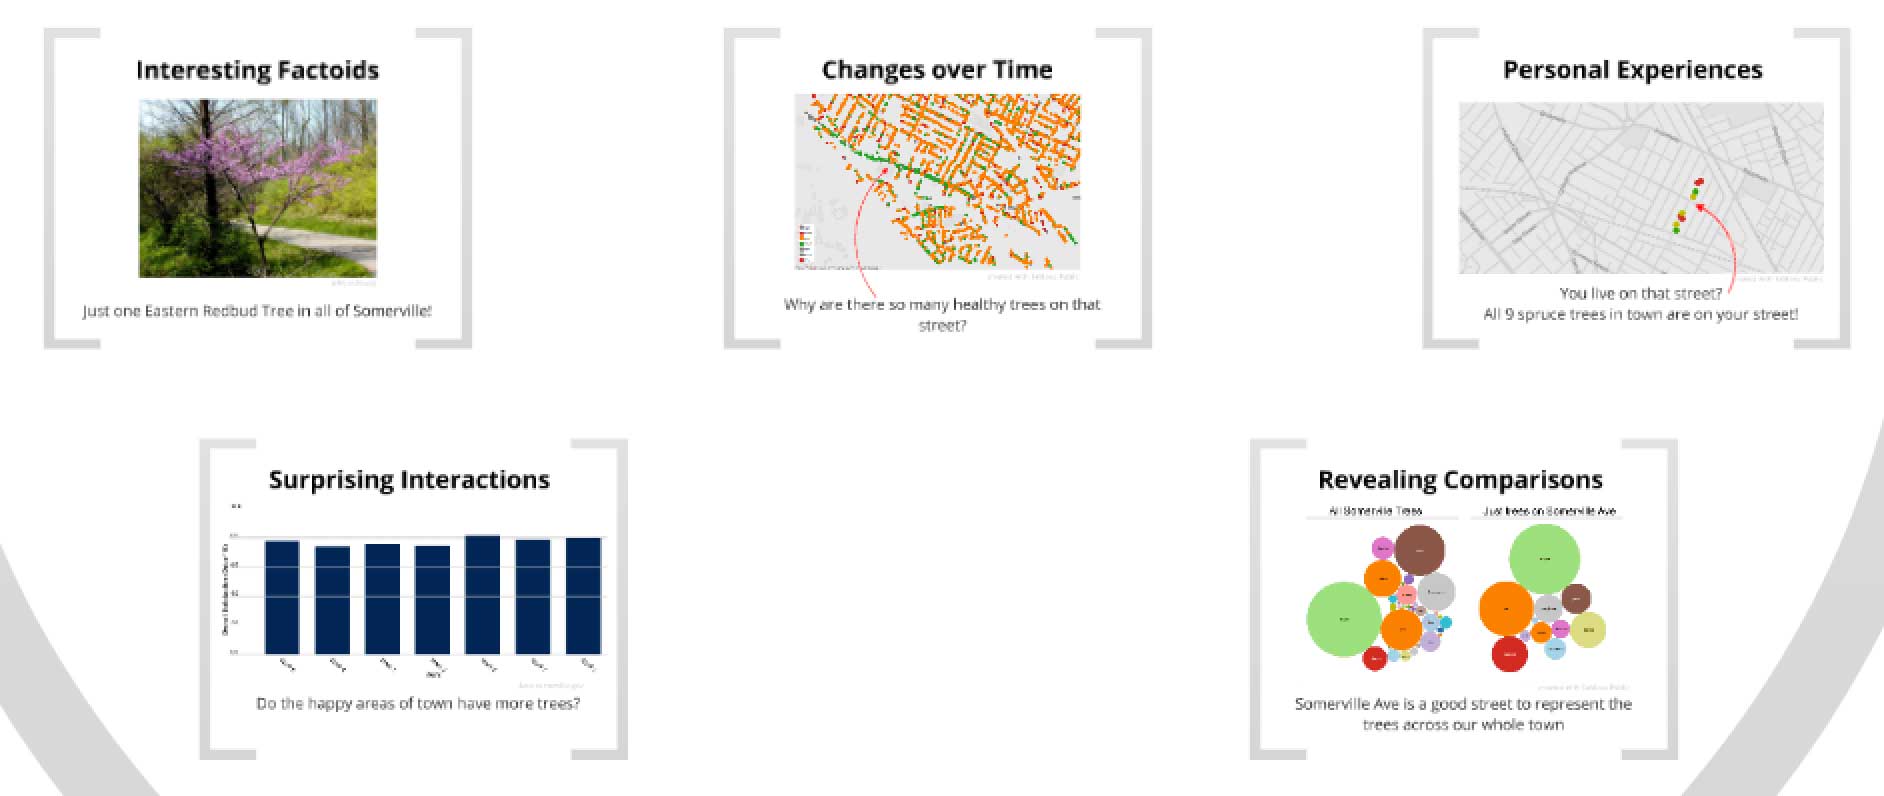
Start off by introducing an example dataset. We use the Somerville Tree Audit (a list of all the trees in our hometown). Run through an example of each type of story with this dataset:
- connection stories
- comparison stories
- change stories
- personal stories
- factoid stories
Now introduce the real dataset, giving any paper copies to the participants. Then break the participants into five smaller groups, each assigned one type of story. Hand out the story type template to the appropriate groups (ie. the “connection stories” group gets the “connection stories” template). Give them 10 minutes to look-over the data, trying to find stories of the type they are assigned. Tell each group to come back with their top two most compelling stories, written up on the templates.

To finish the activity, tape all the stories to the wall and spend a few minutes doing a “gallery walk” – giving everyone a chance to read each other’s stories.

This is such a useful activity. I’ve run it for the past 4 years with design students at Northeastern in my Designing Infographics class.