New Blog Home!

You may have noticed I’ve been quite on this blog for a while. I’ve started a new position as an Assistant Professor in Journalism and Art + Design at Northeastern Unversity! I’ve launched the Data Culture Group there, where I’ll be working with others to builds collaborative projects that interrogate our datafied society with a focus on rethinking participation and power in data processes. I invite you to keep an eye on that new blog for updates on my workshops, projects, and writing on data literacy and culture.

https://dataculturegroup.org

A screenshot of my new Data Culture Group’s blog.

Speaking Data

Here’s video and a writeup of a short 5 minute talk I gave recently at the 2014 Civic Media Conference.  I attempt to tease apart my definition of “popular data” by comparing it to the concept of “data literacy”.

Do you “speak data”?  As more and more businesses and governments are making data-driven decisions, this question is becoming more important.  Your ability to speak data is directly related to your ability to engage with those institutions.  For governments this is a critical issue because they are meant to engage the citizenry.

image 2

Most folks try to address this, talking about it as “data literacy”, but that doesn’t quite capture the whole idea.  The concept of “literacy” suggests a spectrum:

  1. the illiterate: those that can’t participate in written discussion
  2. the readers: those that can take in the ideas of others who have written them
  3. the writers: those who can capture their ideas on paper


The idea of literacy is to move people from illiterate to reading, but the writers are those in control.  The writers are those with the power.  With data, we need to make more readers for sure.  However, the bigger issue is that we can’t just focus on readers when actually we need better writers.  This is the piece I see missing from the data literacy work misses.

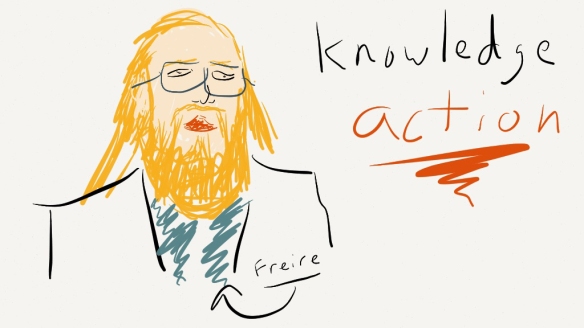
So who are the existing data writers?  Newspapers, community groups, governments, businesses – they all generate data-driven stories for the readers.  So how do we make those passive readers into data writers?  Well, my studies in the Lifelong Kindergarten Group point me back to Paulo Freire, the Brazilian philosopher and educator.

image 5

Freire’s concept of popular education stemmed from his early work on adult literacy, where he focused on learning literary skills by reading local newspapers.  The ideas was that the content and context would empower the learners.

There are a few tactics of popular education that are key:

  • you must value what each individual brings to the table as a unique and meaningful addition
  • the teacher/educator is more of a facilitator for the learners
  • thought most be combined directly with action
  • the action must be tied to local community needs

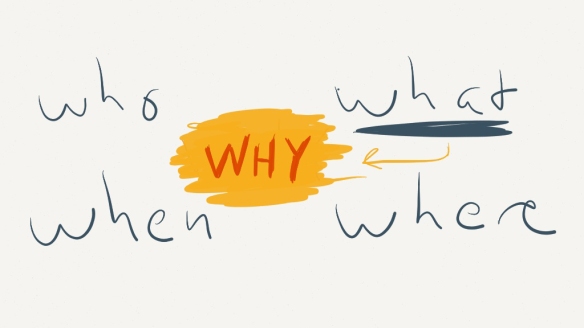
So combine these tenants with the basics of data literacy and you get my new concept of popular data.  Whats the difference? Data literacy is about the what.  Popular data is about the why. 

image 14

That’s all really abstract.  Lets run through some examples of how this works in the real works.

Newspapers

Newspapers have always played a critical role informing the public.  They’ve moved this into the data-driven era by way of things like the Data Driven Journalism Handbook and numerous trainings to help journalists find and tell stories with data.  Similarly, they are experimenting with new interactive ways to write exploratory and explanatory data-driven articles.

Governments

Our partners in the state government of Minas Gerais, Brazil realized that an open data portal was the start, not the end, of their open data initiatives.  They brought us down to do a series of lectures, workshops, and a data mural that tried to build local capacity to work with that data to advocate for change.  This was about turning those readers into  writers.  I argue governments, as they embrace more data-driven policy, have a moral duty to help their constituency speak data.

Community Groups

These folks could be aptly-described as semi-literate.  All Data Therapy workshops aim to build their capacity to present data in more creative and appropriate ways.  This is about making them better writers.

Regular Folks

These are the “illiterate”, to a certain extent.  To help them become readers and writers, we created the Data Murals project.  We want to use the engaging power of the arts to invite them to learn to speak data.  This involves creating participatory workshops to engage them when looking at data to find a story, and then collaboratively designing a visual to tell that story, and then paint it as a mural.  This is an empowerment effort.

These are some key examples of what popular data means in practice, and why it is important to go beyond the concept of “data literacy”.

Making Events Better

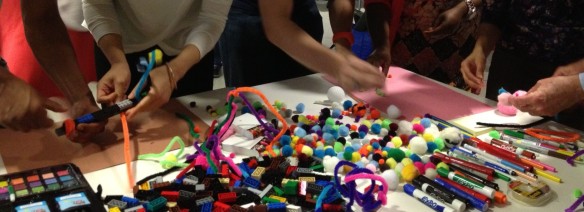
Most meetings and events suck.  I’m lucky enough to know lots of folks trying to make this better.  Recently Civic Media hosted Gunner from Aspiration Tech for a training on how to create and facilitate  participatory events. Afterwards I was inspired to reflect more on my own approach to facilitating the workshops and events I run. A key reflection for me was that I put a strong emphasis on the process of collaboratively making of things. Our Data Therapy workshops and events are “think with your hands” events.  Almost every topic is tied to a hands-on activity where you make something with your peers.  This is how we invite participants to engage in the material – through the process of making things.

our Data Therapy "Data Sculpture" invitation to make
our Data Therapy “Data Sculpture” invitation to make

A key role of the facilitator in any event, meeting, or workshop is get people engaged. As facilitators, we use a variety of techniques and tools to do this – creating many invitations for a diversity of participants.  I think about this as three categories of invitations: invitations to speak, invitations to move, and invitations to make.
We have various ways that we invite people to speak and listen.  Two examples:
  • we can “read” the room and invite comments from those that have been silent for a while
  • we can set ground rules about argumentation and debate, personal attacks, etc (Aspiration Tech notes on ground rules)

Other invitations rely on physical movement to engage those that otherwise might not speak.  Three examples:

  • we can do brainstorms that get people up and moving around Post-It notes on a big wall
  • we can change the physical dynamic by breaking a larger group into smaller ones
  • we can offer movement by running a spectrogram to gauge diversity of opinions on a controversial topic (Aspiration Tech spectrogram notes, P2PU-course spectrogram notes)

from Heather Leson
photo by Heather Leson

I’m proposing we think harder abut this third type of invitation, where we invite participants to make something.  Two examples:
  • we can offer the construction of a collaborative object that symbolizes the theme and is an output of the meeting or workshop
  • we can create short opportunities to make something small that explores a topic, coupled with a short window to share what was made with peers (we do this a lot in our Data Therapy workshops)
I think the invitation to make is underused in facilitation and workshops.
That said, there are a number of people I see offering this invitation in a variety of ways. Here are some of the inspirations I’m drawing from:
  • The “Maker” movement – Obviously these folks are using the process of making and sharing to build community.
  • Tactical Technology Collective – Their events invariably have hands on components with an artistic approach, but at the InfoActivism Camp 2014 I found it to be on the periphery.
  • Discotechs – I’ve recently learned more abut this model from my colleague Sasha Costanza-Chock. I understand they historically integrate the collaborative construction of a disco ball as a centerpiece activity, and their philosophy looks like it centrally integrates creative activities where you make things.
  • IISC -The facilitative leadership training I attended included a short hands-on “challenge” involving cardboard tubes, tape, etc. It was integrated well into the topic of the training, and fun.  The reflective discussion they led afterwards connected to many themes of the training.
  • Connection Lab – My wife and Data Therapy collaborator Emily does amazing work offering collaborative arts activities as a community building activity for those working the world of public health.
  • Team building – There is a large market of team building activities sold to businesses trying to focus on internal community; many of these involve creative activities.
  • Arts therapy – I understand that the world of arts therapy uses the creative act to surface underlying issues and start difficult conversations

I’m looking forward to exploring these ideas more with people here at Civic Media, and if you’re interested let me know!  Are “Making” events better?  When we provide more invitations to make, are we making events better?

Notes: This is cross-posted to the Civic Media blog.

Permission to Play

After our training-of-trainers workshop in Belo Horizonte in March, someone asked me:

How do you get a room full of executives in skirt suits or ties to play with materials from a child’s playroom?

I thought I’d take to opportunity to reflect on that question, because giving people permission to play is a critical piece of our “Data Therapy” approach.

Usually our workshops start with some introductions, where I mention my time doing a master’s degree under Mitchel Resnick in the MIT Media Lab’s Lifelong Kindergarten group.  I always introduce the educational approaches I learned there, and its connections to the Media Lab’s approach to work.

That’s right, I have an advanced degree from a group called “Lifelong Kindergarten”.  From MIT.  It’s hard to overstate the privilege this background gives me in “rooms full of executives”, or most other rooms.  I can get away with things like asking them to build with pipe cleaners, glue, and pom-poms… and they take me seriously.  Of course, I take full advantage of this, because it gives me a short window of time to convince participants that it is worth following me on this journey!

When I give folks permission to play, they take it.  The key insight I’d offer though, is that most people are looking for permission to play.  Working with data is too often rendered boring by hard-to-learn tools and stuffy restrictions on looking “official”.  People want to do interactive, hands-on activities.

The kind of privilege my MIT credentials give me is powerful, but doesn’t last long if my content isn’t relevant.  Our hands-on activities, my facilitative energy, the insights of their peers, and the content of the workshops keeps folks engaged and interested.  You can do all that without having an MIT degree! People want to play… it is up to you to give them, and yourself, permission.

Thoughts on “Big Data” & “Small Data”

I’ve seen a lot of writing lately on Big Data vs. Small Data.  I know this is something I should pay attention to, because they are capitalizing words that you usually don’t capitalize! Here are some still-forming thoughts…

Rufus Pollock, Director of the Open Knowledge Foundation, recently wrote on Al Jazeera that:

Size doesn’t matter.  What matters is having the data, of whatever size, that helps us solve a problem of addresses the question we have – and for many problems and questions, Small Data is enough

He argues that Small Data is about the enabling potential of the laptop computer, combined with the communicative ability unleashed by the internet. I was sparked by his post, and others, to jot down some of my own thoughts about these newly capitalized things.

How do I Define Big Data?

Big Data is getting loads of press.  Supporters are focusing in on the idea that ginormous sets of data reveal hidden patterns and truths otherwise impossible to see.  Many critics respond that they are missing inherent biases, ignoring ethical considerations, and remind that the data never holds absolute truths.  In any case, data literacy is on people’s minds, and getting funding.

My working definition of what Big Data is focused more on the “how” of it all.  For one, most Big Data projects run on implicit, unknown, or purposely full hidden, data collection.  Cell phone providers don’t exactly advertise that they are tracking everywhere you go.  Another aspect of the “how” of Big Data is that the datasets are large enough that they require computer-assisted analysis.  You can’t sit down and draw raw Big Data on a piece of paper on a wall.  You have to use tools that perform algorithmic computations on the raw data for you.  And what do people use these tools for?  They try to describe what is going on, and they try to predict what might happen next.

So What Does Small Data Mean to Me?

Small Data is the new term many are using to argue against Big Data – as such it has a malleable definition based on each person’s goal!  For me, Small Data is the thing that community groups have always used to do their work better in a few ways:

  1. Evaluate: Groups use Small Data to evaluate programs so they can improve them
  2. Communicate: Groups use Small Data to communicate about their programs and topics with the public and the communities they serve
  3. Advocate: Groups use Small Data to make evidence-based arguments to those in power

The “how” of Small Data is very different than the ideas I laid out for Big Data.  Small Data runs on explicitely collected data – the data is collected in the open, with notice, and on purpose.  Small Data can be analyzed by interested layman.  Small Data doesn’t depend on technology-assisted analysis, but can engage it as appropriate.

So What?

Do my definitions present a useful distinction?  I imagine that is what you’re thinking right now.  Well, for me the primary difference is around the activities I can do to empower people to play with data.  My workshops and projects focus on finding stories, and telling stories, with data.  With Small Data, I have techniques for doing both.  With Big Data, I don’t have good hands-on activities for understanding how to find stories.

I connect this primarily to the fact that Big Data relies on algorithmic investigations, and I haven’t thought about how to get around that.  Algorithms aren’t hands-on.  You can do engaging activities to understand how they work, but not to actually do them.  In addition –  most of the community groups, organizations, and local governments I work with don’t have Big Data problems.

Put those two things together and you’ll see why I don’t focus on Big Data in my work. Philosophically, I want to empower people to use information to make the change they want, and right now that means using Small Data.  That’s my current thought, and guides my current focus.

Towards a Concept of “Popular Data”

I was recently invited to give a Skype keynote for the first hackathon hosted by the state of Minas Gerais in Brazil.  The talk was a wonderful provocation to revisit the writing of another Brazilian I used to study – Paulo Freire and his vision of popular education.  This led me to wonder… what would a model of “popular data” look like? Answering this requires an agreement that there is a problem, and agreement that the problem merits a popular education approach.  This post is an exploration, so I end by proposing a few grounding principles for a concept of “popular data”.  Is this a useful concept?

The Problem

Governments large and small are speaking of open-data platforms and data-informed decision making.  They share with us a vision of responding to citizen concerns more accurately and efficiently based on data.  These governments are using the language of data.  Data is a language governments are speaking, but most people don’t understand This is the core problem that I address with my Data Therapy project.

speak data?

Can Popular Education Help?

If you don’t speak the language used by your government to make decisions, then you can’t participate in those decisions.  This disempowers people, and popular education is an approach for rectifying disempowering situations.  The city I live in, Somerville, MA, has a a program called “ResiStat” that is intended to 

bring data-driven discussions and decision-making to residents and promote civic engagement via the internet and regular community meetings

This data-centered effort can only engage those that already understand the charts, graphs, and terms they use.  Don’t get me wrong – they don’t deliver a dry academic lecture at their community meetings.  However, they do rapidly run through reams of data analysis with an expectation that most in the audience can handle the information-centered explanation.  This leaves out the many residents who don’t speak data at all.

What is Popular Education?

Philosophical definitions are always debated, but here are a few guiding principles most practitioners of popular education would adhere to:

  • participation from all parties
  • learner guided explorations
  • facilitation over teaching
  • accessibility to a diverse set of learners
  • focus on real problems in the community

If you consider this list a litmus test for governmental data programs, few (if any) would pass.  So how do we change this?

Popular Data?

Now that you’re (hopefully) on board with my problem statement, and the idea that popular education can help, lets play out how. Popular data is my name for engaging, participatory approaches to data-driven presentation and decision-making.  Not a great name, but from an academic point of view it puts my work in the right family tree so I’ll use it for now. How do you structure data programs to practice popular data? Lets run through each of the tenants listed above and look at some examples.

Participation from All Parties

Popular Data suggests a “big tent” approach; you should get everyone at the table.  For instance, far too many open-data initiatives end at the release of the data.  The smart ones realize they are the scaffolding for larger efforts, and make a strong effort to convene non-profits, constituents, and the data makers to the table in order to encourage activity around the data.  Sometimes this looks like a hackathon that makes sure to invite lots of segments of society (ie White House hackathon). Sometimes this looks like a presentation of results back to the people the data is about (ie. Somerville’s ResiStat meetings).  There are lots of ways to involve those in power positions and those outside of them.

Learner Guided Explorations

Most data presentations are about as engaging as a conversation with your dentist! You kind of have to do it, but it’s booooring. Flipping the model invites your audience to find their own stories in the data. My Data Murals work does just that – our initial “story-finding” workshop shares a small portion of the data about a topic and then lets teams of participants find stories they want to tell.  Participants own these stories and advocate for them.  That is an empowerment story – our evaluations show people come away feeling more capable of finding stories in data, and are less intimidated by data in general.

Facilitation Over Teaching

In my Data Therapy workshops I use a number of activities for building visual literacy. All of these are ways to facilitate a discussion of data presentation, and build a shared language for describing data.  When data scientists introduce ideas they too often fall back on big words.  These words alienate those who haven’t studied data.  My first step is to use language a normal person would use.  Then I help the group construct their own language for describing data, which they fully understand.

Accessibility to a Diverse Set of Learners

I spent years designing interactive museum exhibits. Museums are the hardest setting I’ve ever designed for.  At a museum you know nothing about your audience; your object has to support 30 second interactions with a single person, but also 1 hour interactions facilitated by a knowledgeable docent.  This is hard.  Really, really hard.  Data presentations and activities need to be designed the same way. I address this by starting simple, and building to complexity.  In data presentations I do break into small groups and seed each with one person that does speak data to help the other folks understand technical issues.

Focus on Real Problems in the Community

This one is easy! Make the data you are working with or presenting relevant to the communities you are working with. In the workshops I lead in the Boston area, I use the Somerville happiness survey as my silly example data set.  I wouldn’t do that for a group of public health wonks (I’d use something from the WHO).  People are naturally inclined to be engaged about the community they live in – no need to introduce data from some far off community they have no relation to.

Is this Useful?

Ok, so I’ve made my argument – I see every dataset as an opportunity for engagement.  Engagement with the public, the people the data is about, the people whole collected it, everyone. If you’re reading this, it’s up to you to use a Popular Data approach to seize the opportunity for engagement a dataset gives you.  I find this framework useful for structuring my data presentations and workshops.  Let me know what you think!  Am I just naming something obvious? Am I being too academic?

crossposted to my Civic Media blog

Being Data Informed

Earlier this summer I sat in on a webinar by Beth Kanter on running a “Data Informed” organization.   Here are some reflections on her topic.

I talk a lot of about creative ways to present data-driven stories, but you have to have data to get there.  Many organization and community groups are still thinking about how to integrate data gathering into their work.  For those folks, and everyone else, I suggest taking a look at Beth Kanter’s latest book – Measuring the Networked Nonprofit.

Book Cover

She runs through a process for going form crawling to flying with your data.  This approach of growing engagement over time is a great way to think about integrating data into your organization’s behavior.  For many groups this is about culture change, not one time data expeditions.

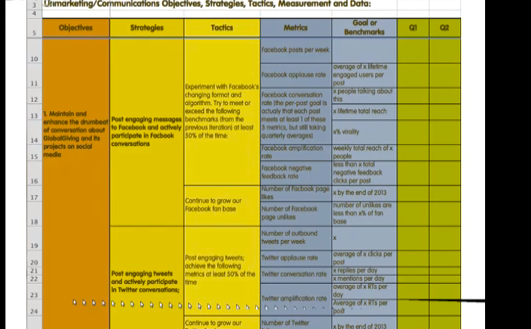
2013-05-02_1422Even better, she gave examples about how to create reasonable metrics for campaigns that involve social media.  This kind of guidance is invaluable because it gets past some of the hand-waving about follower counts and so on.
2013-05-02_1449


In all this, she uses the term “data-informed”.  What’s up with that?  Beth says this is important because:

Data-informed cultures are not slaves to their data.

I like that.  I think I may need to embrace this term more, because it better reflects how I think this work.

The Case for Informal Visualization

Data visualization is all over the place. On the hype curve, we’re clearly up in the area of inflated expectations. If you listen to the reporting, you wouldn’t be blamed for thinking dataviz is going to bring world peace! I’m writing to beat the drum in favor of more informal presentations.  You can tell better data stories, and engage your audience more, by creating less formal data presentations.

Some Examples

What do I mean by “informal visualization”?  To start, toss out your computer, printer and graph paper. Pull our your crayons, big paper, tape, and your imagination.

From top-left, clockwise:

Another example is the Data Mural pilots I’ve been doing with artist, facilitator (and my wife) Emily Bhargava.  We’re leading groups through finding a story in their data, creating a collaborative visual design for a mural, and then painting it! (read more on my Data Therapy blog and Emily’s Connection Lab blog).

Stuff Academics Say

I work at a university, so I have to mention some of the research in this area.  First up – there is a great paper out of the City University of London, called “Sketchy Rendering for Information Visualization“.  Basically, they get a computer to draw graphs as if they had been drawn by hand.  My main takeaway was that their “sketchy” graphs engaged people more than the more “official” looking ones with straight lines.

Secondly, the Data Stories podcast had a recent episode called “Data Sculpture” in which they spoke with people investigating physical data presentations.  If you listen to it, be prepared for a lot of academic jargon – their audience is not the general public.  My main takeaway from the paper referenced (“Evaluating the Efficiency of Physical Visualizations“) was that when people physically touched the 3d objects representing the data they did a better job understanding the data.

It’s Arts & Crafts Time

Beyond these examples, and academic rationale, making informal visualizations is just flat out more fun.  As with most things, I think there is a cultural issue involved here.  Western culture has an inexplicable (to me) emphasis on professionalism and looking like an expert. When I’ve worked in Central America, South America, and India I’ve found the professions more welcoming to informal data presentations like those I show above.  Perhaps this was due to resource constraints, but it almost always led to better sessions.

Whie doing my master’s in the Lifelong Kindergarten group here at the MIT Media Lab, I fully joined the tribe that talks about how making physical things is the best way to communicate your ideas. This “constructionism” approach has feuled all my work since then, and I see this call for informal visualization as a way to bring it to the dataviz world.

So what does this mean in practice?  For me, I’ve taken to doing less on the projector and more on paper.  I encourage community groups I work with in Data Therapy sessions to partner with local artists and schools. I push businesses and organizations to thing about their audience and goals harder before jumping into making data presentation.  (PLUG: come to my “Fight the Bar Chart” meetup here in Boston to learn more about that)

If you want to look like a “sage on the stage”, by all means be as formal as you can.  However, if you want to engage your audience around a data story, try having some art and crafts time before your next data presentaton.

 Cross-posted to the MIT Civic for Civic Media Blog

Data as Disempowerment

Data is hot. That isn’t exactly a radical statement. I doubt I could find anyone to disagree. Unfortunately, using data often disempowers far too many people.

The three phases of data therapy

Most of the work on data right now is happening in the realm of “transparency” – opening up previously hidden data for others to use. I talk about all this work as the first phase of Data Therapy. It is a necessary precursor, but of course not an end in itself.

The second phase of Data Therapy involves taking data and effectively telling a story with it, based on your audience and goals. Most of my Data Therapy work has focused on this phase. I try to assist by identifying techniques for data story-telling and providing case studies to help decide when to use each technique.

The third phase of Data Therapy is about taking data full circle – helping the communities described by the data take ownership of the stories being told. This is why we’re so excited about the Data Mural that just got started!

Excuse me, do you speak data?

The thing is, the second phase (effectively telling data stories) often makes assumptions about data literacy, and ends up disempowering large swaths of the population. As we move into a world where more and more civic decisions are data-driven, those in power are becoming more data-literate. They are becoming more agile with the language of data. This approach can quickly disempower those without any data literacy.

Language has a tradition of being used to deny one class access to empowerment. The Roman Catholic Church resisted an english language bible. Techies (like me) purposefully use technical jargon to stay aloof about our wizardly. Lawyers to this day speak an unidentified language that they spend years learning in special schools!

The thing is, it doesn’t have to be that way. I take two approaches to empowering people with data:

  • Present data creatively
  • Educate the public in the language of data

Being a graph nerd, I think about this on an axis. One end is “data speak”, the other “regular language”.

data axis

I’m trying to do both. Every data presentation is a trojan horse, holding within its false belly a chance to address the problem of data literacy. We need to be explicit about this if we want to overcome data’s natural tendency to disempower.