
This activity and write-up was contributed by my long-time collaborator Catherine D’Ignazio.
The Analog Spreadsheet can be used as an icebreaker activity for groups of 10-30 people. Participants fill in information about themselves into a large, paper table and then the facilitator leads a group discussion about the information that has been collected.
This is an introductory activity – perfect for non-technical newcomers to familiarize themselves with basic concepts like “data”, “datasets”, “data types” and “cleaning data”.
Number participants:
- 10-30
- If you have more than 30 participants, consider running this activity with a digital Google spreadsheet. Each participant fills out their information on a single row. Participants would then need access to computers, however.
Learning Goals:
- Introduce participants to each other (“icebreaker” activity)
- Familiarize participants with a definition of data as “systematic observations about the world”
- Familiarize participants with the concept of data types
- Introduce the idea of cleaning data and the motivation for cleaning
- Introduce the idea of data analysis and storytelling within a dataset
Materials:
- Giant gridded piece of paper. The bigger and more colorful, the better! You can order cheap rolls of colored bulletin board paper here.
- Large, thick markers
- Tape to hang Analog Spreadsheet
- Flat wall to hang Analog Spreadsheet

Prep time: 1 Hour
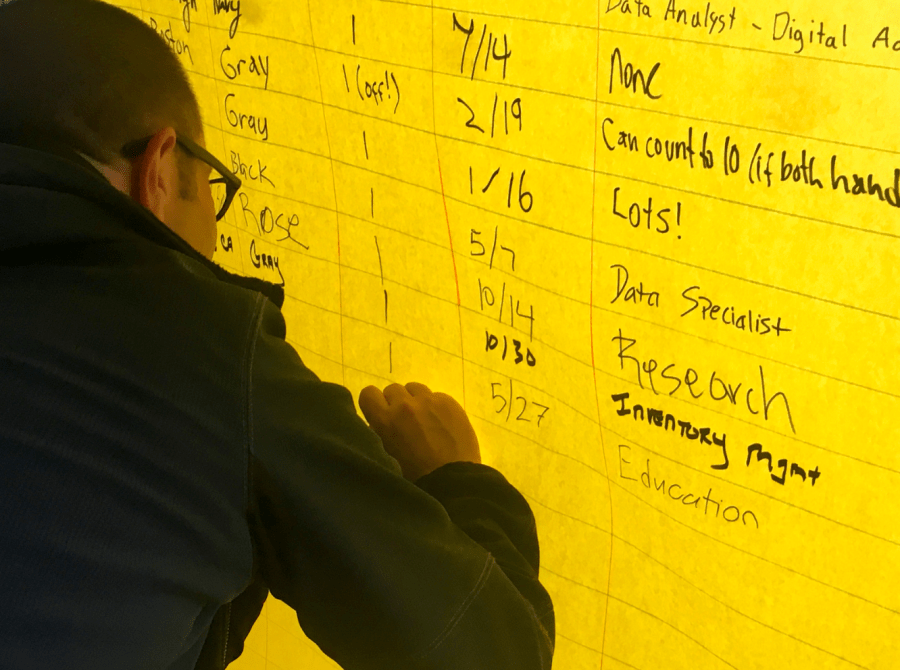
- Prepare your Analog Spreadsheet. Create a grid on your giant sheet of paper with at least five columns of personal information. We try to cover most of the major data types with the columns, e.g.:
- First name – qualitative data
- Hometown – geographic data
- Color of Your Shirt – categorical data
- # Siblings you Have – quantitative data
- Day & Month of your Birthday – temporal data
- Describe any experience with data – open text as data
- Feel free to customize the columns for your audience but make sure you are not collecting sensitive personal information or anything that would be embarrassing.
- Use a long ruler or a large cardboard box to draw your grid.
Running the Activity: 45 minutes
- Before the session begins and 10 minutes into the session – This is a great activity to open up a learning session. As participants arrive, ask them to fill out a row about themselves in the analog spreadsheet.
- 5 minutes – Invite a couple volunteers to introduce themselves using the spreadsheet.
- 10 minutes – “What are Data?” Discussion
- Tell participants that they have just made a “dataset”, basically a table of systematically collected observations about the world
- Each row is an observation
- Ask the group: “What’s missing from this data set? Does your row capture everything about yourself as a person?” (Answer: No, of course not. The purpose of gathering data is to make some kind of helpful reduction of the world. So, while the data are systematic, they are not the final word and you might not have always collected the right data for your question.)
- Another example: “What about shirt color?” – People invariably have on shirts that consist of more than one color, patterns, and so on. You can use this as an illustration of how the data often reduce the complexity of the world into something manageable.
- 10 minutes – “Data Types” Discussion
- Ask participants: “Often, we think of data as consisting of only numbers. But what types of data other than numbers do you see represented here?”
- As people volunteer types of data, then follow up and ask them, “What could we do with this type of data? How could we start to organize it?” For example, if people see temporal data, we could plot it on a timeline. If people see geographic information, we might want to make a map. If people see text data, we could look for the most common words.
- The point: Different types of data lend themselves to different ways of exploring, grouping and sorting. Noting what data type a column is can lead you to look at it in a certain way.
- 10 minutes – “Data Cleaning and Storytelling” Discussion
- Ask participants: “What challenges would you face if you were going to make a map of this data?” Typically, people specify the “hometown” column very differently. Sometimes it has a town and state. Sometimes a country. Same with the “shirt color” and “birthday” columns. Data is often collected informally and in an unstandardized way, but to plot it systematically we need to clean and standardize it.
- Ask participants: “What kinds of patterns can you start to see from this data?” For example, in the # siblings columns – who has the most? The least? What’s the average? Walk through the other columns and start to notice their patterns. Ask participants: “Anything surprising that you see here?”
- Return to the people who introduced themselves at the beginning – ask the group “How typical is Sandra of the rest of the group? Would you say she’s a typical participant at this workshop?”
- 5 minutes – Review. Remind participants that they learned that:
- Data are systematic observations of the world
- A dataset is the collection of those observations
- Data are a helpful reduction of the world – it’s important to keep in mind they do not capture everything
- The type of data collected (temporal, geographic, quantitative, etc) affects the kinds of exploration and pattern making that you can do
- Data often needs to be cleaned and standardized
- Data storytelling and analysis involves looking for patterns, making comparisons, finding outliers, and then testing that knowledge in dialogue with others.

You must be logged in to post a comment.